
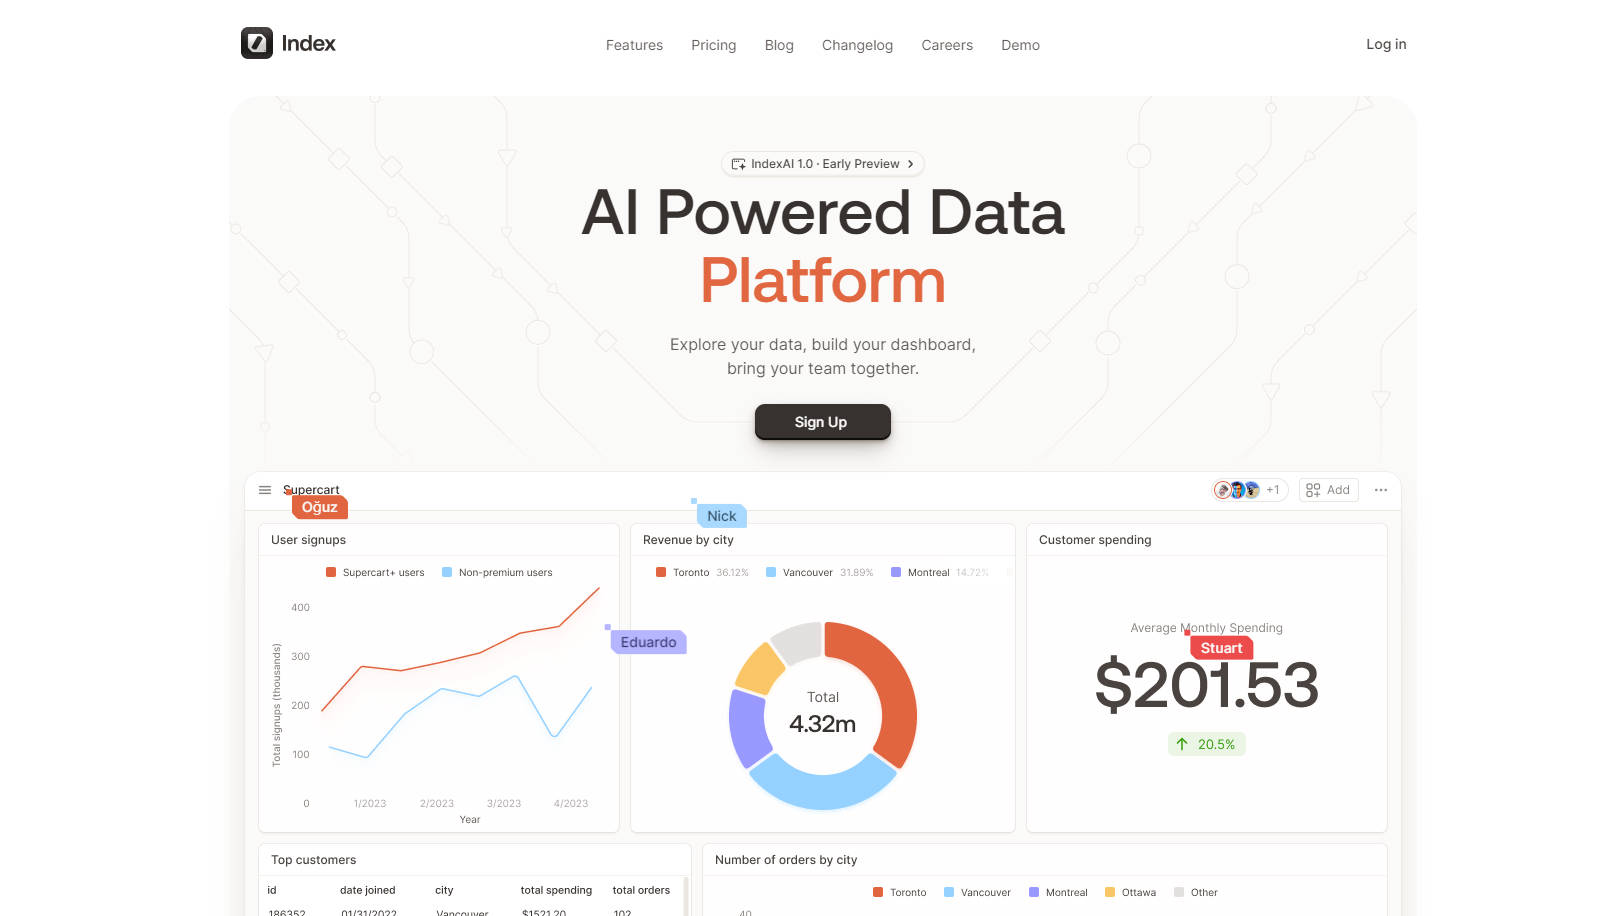
What is Index?
Data analysis shouldn't be a solo mission confined to spreadsheets and complex tools. Index is a collaborative business analytics platform designed to empower your entire team to unlock the power of your data. Whether you're a seasoned SQL expert or prefer a visual approach, Index provides the tools you need to explore data, build insightful dashboards, and share discoveries with ease. Stop working in data silos and start making data-driven decisions together.
Key Features:
📊 Visualize Data with Powerful Charts: Transform raw data into actionable insights with a comprehensive suite of customizable visualizations. Choose from line charts, bar charts, pie charts, scatter plots, area charts, and single-value displays. Customize every detail, from axis scales and colors to trend lines and goal lines, to create compelling visuals that tell your data's story.
🔎 Query Data Your Way: Access and analyze your data using either a traditional SQL editor or an intuitive visual query builder.
SQL Editor: Directly write and execute SQL queries for precise data manipulation.
Visual Editor: Construct queries without code, perfect for team members who prefer a drag-and-drop interface.
🤝 Collaborate in Real Time: Work together seamlessly on dashboards and analyses. See changes made by your teammates instantly, fostering a truly collaborative environment. Leave comments and annotations directly on data points to facilitate discussions and ensure everyone is on the same page.
🗄️ Connect Multiple Data Sources: Bring all your data together in one place. Index supports connections to a variety of databases and data warehouses, streamlining your workflow and eliminating the need to juggle multiple tools.
⚡ Experience Performance-Focused Design: Enjoy a fast and responsive platform. Index is built for speed, ensuring that interactions feel instantaneous, allowing you to stay focused on your analysis without frustrating delays. Offline support ensures you can keep working even without an internet connection.
🔍 Utilize Remarkable Search Capabilities: Quickly find what you need. Index's powerful search function spans tables, queries, datasets, and dashboards, saving you time and effort.
🎨 Customize Your Workspace: Tailor the platform to your preferences. Switch between light and dark themes to create a comfortable and visually appealing work environment.
⌨️ Streamline Workflows with the Command Bar: Access all of Index's features with just a few keystrokes. The command bar provides a central hub for actions like inviting team members, renaming boards, changing themes, and creating new blocks.
Use Cases:
Marketing Campaign Analysis: A marketing team connects Index to their CRM and advertising platforms. Using the visual query builder, a marketing analyst creates a dashboard showing customer acquisition cost by channel. The team collaborates in real-time, identifying underperforming campaigns and reallocating budget to maximize ROI. They then share this information with the sales department.
Sales Performance Tracking: A sales manager uses the SQL editor to query their sales database, creating a report that tracks individual sales representative performance against targets. They visualize the data as a bar chart, making it easy to identify top performers and those who need additional support.
Product Usage Monitoring: A product team connects Index to their product analytics database. They build a dashboard that tracks key metrics like user signups, feature usage, and churn rate. The team uses the collaborative features to discuss trends and identify areas for product improvement.
Conclusion:
Index empowers your team to move beyond static reports and embrace a dynamic, collaborative approach to business analytics. With its flexible query options, powerful visualizations, and seamless collaboration features, Index helps you transform raw data into actionable insights, driving better decision-making across your organization.
More information on Index
Launched
2018-05
Pricing Model
Freemium
Starting Price
Global Rank
2533083
Follow
Month Visit
7.8K
Tech used
Google Analytics,Google Tag Manager,Sign in with Google,Google Fonts,Google Cloud Platform,HTTP/3,Progressive Web App,Stripe,Nginx
Top 5 Countries
45.89%
29.74%
8.2%
6.1%
3.64%
United States
India
Russia
Indonesia
Turkey
Traffic Sources
6.6%
1.06%
0.13%
10.4%
40%
41.69%
social
paidReferrals
mail
referrals
search
direct
Source: Similarweb (Sep 25, 2025)
Index was manually vetted by our editorial team and was first featured on 2025-03-08.
Related Searches
Index Alternatives
Load more Alternatives-

Analytic Bridge: AI-powered data analysis. SQL, Python, chat, & interactive notebooks. Transform data into actionable insights!
-

Unlock the potential of your data-driven business with InsightBaseAI. Gain deep insights, monitor data in real-time, and improve operational efficiency. Get started today!
-
Stop drowning in data logs. Query Inside uses AI to search, analyze, and monitor your system data for instant, actionable insights.
-

-
Get actionable insights from your data with Insights AI. Ask questions naturally, find hidden patterns, visualize findings, and make smarter business decisions.