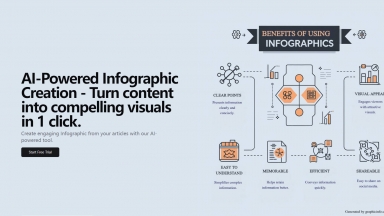
Infography
| Launched | 2024-02 |
| Pricing Model | Paid |
| Starting Price | $9.99 /month |
| Tech used | JSDelivr,unpkg,Google Fonts,Svelte(Kit),Vercel,Gzip,JSON Schema,OpenGraph,HSTS,YouTube |
| Tag | Social Media Marketing,Text to infographic,Twitter,SEO Optimization,Bloggers,Content Creation |
GraphicInfo
| Launched | 2024-07 |
| Pricing Model | Freemium |
| Starting Price | $11.99/Month |
| Tech used | Google Analytics,Google Tag Manager,Gzip,OpenGraph |
| Tag | Instagram Assistant,Marketing Material Generator,SaaS,Marketing Analytics,Text to infographic,Website Design |
Infography Rank/Visit
| Global Rank | 160766 |
| Country | Nigeria |
| Month Visit | 419188 |
Top 5 Countries
18.54%
12.3%
8.05%
7.57%
6.49%
United States
Brazil
China
India
France
Traffic Sources
56.27%
24.89%
13.61%
4.39%
0.55%
0.28%
Direct
Search
Referrals
Social
Paid Referrals
Mail
GraphicInfo Rank/Visit
| Global Rank | 1256721 |
| Country | Egypt |
| Month Visit | 23315 |
Top 5 Countries
18.04%
7.63%
6.11%
5.39%
4.69%
United States
United Kingdom
India
Taiwan, Province of China
Canada
Traffic Sources
38.67%
31.55%
22.44%
4.56%
1.75%
0.88%
Direct
Referrals
Search
Social
Mail
Paid Referrals
What are some alternatives?
When comparing Infography and GraphicInfo, you can also consider the following products
Infogram - Infogram 是一款由 AI 驅動的工具,提供可自訂的範本、互動式內容和進階分析功能。它讓使用者能夠為行銷、教育和非營利組織製作令人驚豔的資訊圖表。在所有裝置上都能無縫使用。
Text2Infographic - Text to Infographic 是一款 AI 圖表生成器,可以將您的文字轉換成視覺化內容,適用於您的部落格、社群媒體等等。
Infographic Ninja Ai - 教育工作者、部落客和 SEO 代理商可以使用 AI 將現有內容轉換為資訊圖表,從而加快其內容創作速度。這個自動化資訊圖表產生器只需點擊幾下,就能將部落格文章或單一關鍵字轉換為品牌資訊圖表。
EzyGraph - EzyGraph:免費 AI 資訊圖表製作工具。立即將文章與部落格轉換為引人入勝的視覺內容。簡單易用且高度客製化,有效提升互動率!
 Infography
 GraphicInfo